What is NDepend?
NDepend is a static analysis tool which can be run from your build server or from Visual Studio or as a standalone application.
Disclaimer: The NDepend team kindly made available a copy of NDepend 5.4.1 Professional Edition for me to try out, any opinions within this or subsequent posts are wholly my own.
There’s so much information available within NDepend, from code quality analysis via line’s of code (LOC) through to method complexity analysis and more. Now all these metrics etc. would be useful as they are but NDepend also includes it’s own LINQ like language, where you can edit existing “queries” or create your own to suit your team’s needs.
To find out more about what NDepend is, check out the NDepend website or for a more complete explanation of what NDepend is check out the NDepend wikipedia page.
Let’s get started
I am going to use the NDepend standalone application for most of this post, so fire up VisualNDepend.exe.
For now let’s just use the “Analyze VS solutions” and “VS projects” options on the start page Select one of your projects and then you will see a list of assemblies that make up the project. This is a good point to remove anything you don’t want as part of the end report, i.e. I’ve got a bunch of web service auto-generated assemblies in one solution which I’m not too concerned to see metric on as they’re regenerated by tools (i.e. I’m not going to really be able to do much about the code).
Finally press the Analyze .NET Assemblies button.
Once NDepend has finished its analysis a report summary is created and will be displayed (by default) in a web browser window and VisualNDepend will prompt you asking what you want to do next. I’m going to select the View NDepend Dashboard.
The Dashboard
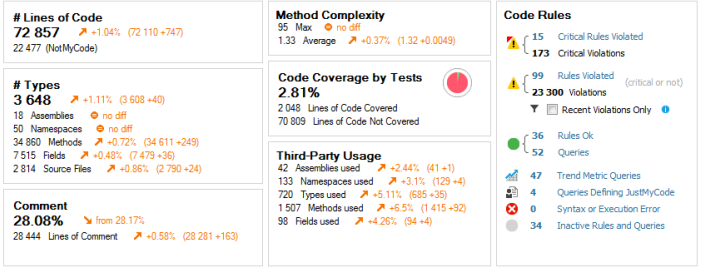
The dashboard is my preferred starting point. Here we can see lots of “high level” information about our solution. One of the projects I work on had over 469,000 lines of “my” code and for this project NDepend took only 45 seconds to generate it’s report – which means we can use NDepend as part of the build server processes without any real performance issues.
The following image shows part of the dashboard for one of my projects. It’s also demonstrating the changes to the project over time using the orange arrows, so my average method complexity has gone up from when I created a base line analysis, mind you everything except comments seems to be on the rise.

Note: The method with the Max complexity is actually a simple switch statement, obviously I took a look at it when it was highlighted in this way to see if it was something to be concerned about. The next step for me, would be to remove this from the complexity analysis results so it doesn’t hide something which is an issue.
Let’s move on an start to break down some of the features of NDepend…
# Lines of Code
This one’s pretty obvious, it shows us the number of lines of code in the solution broken down in my code and “NotMyCode”. In the solution I’m running this against at the moment, I see I have 72,857 lines of code in this application. 22,477 of those are “NotMyCode”. If we click on the number of lines of code (i.e. the 72,857 in my case) we’ll see in the “Queries and Rules Explorer” the “Trend Metrics” are selected. Within this node the “Code Size” is selected and we’ll see that NDepend ran 20 queries as part of this category of queries/rules and this shows the actual break down of LoC as well as the number of sources files etc.
I probably wouldn’t class this as a majorly useful metrics in and of itself, but it’s fun seeing how much code I’ve typed and/or generated for this project and ofcourse I know if I didn’t have it I would have wanted it!
One of the things NDepend can do is keep track of changes of the various metrics, so this might be useful if you see any strange spikes or troughs in your LoC. On the dashboard you’ll be able to scroll down to charts showing changes over time, along with the orange arrow indicators next to the dashboard items. I find this a really useful feature.
# Types
Similar to the LoC, this isn’t maybe one of those metrics you’ll be monitoring very much I suspect, but it’s still nice to get an overview of my project from different perspectives. In this current solution I have 3,648 types, 18 assemblies and so on.
Comment
This one’s probably the least useful metric for the projects I’m working on where comments can end up stale very quickly and therefore we tend not to comment too often. However when writing controls or libraries this metric would be very useful as I tend to be more active in comment usage etc. of methods in such scenarios. I was actually surprised to see I have, however, produced 28% of comments (I suspect a fair few of those were also from some of the autogenerated code I have included in this analysis).
Method Complexity
Now we get to some of the more interesting parts (in my opinion at least) of the analysis.
The method complexity figures within the Dashboard give us an overview, click on the “Max” text and you’ll again see the “Queries and Rules Explorer” change to show us the Max Cyclomatic Complexity for Methods.
The Cyclomatic complexity is a metric of the “number of independent paths through a program’s source code”. According to the NDepend documentation Cyclomatic Complexity (CC) a recommendation is that a CC value higher than 15 means the methods are hard to understand and maintain.
The following is a screen shot of the Queries and Rules Explorer, I’ve disabled some of the built in rules but you can see from the orange border around groups (on the left of the screenshot) that I still have plenty of critical issues outstanding in this project.

Code Coverage by Tests
If you’re using Visual Studio Premium, you get code coverage capabilities. If you save/export your code coverage results to a .coveragexml file this can be read in by NDepend and give me a run down of the LoC covered, the % of the total LoC covered and obviously the number of LoC no covered.
NDepend also supports dotCover and NCover code coverages results files.
Third-Party Usage
This shows us the number of third-party assemblies used etc. All self explanatory so I shall no expand upon here.
Code Rules
The Code Rules section shows us rules violated (critical and non-critical). For this post I’m not going to drill down every rule that I seem to have violated (maybe I’ll leave that for another post). Obviously a tool like NDepend has to have a starting point for what rules it classes as critical – I didn’t always agree with it but that’s not a problem becase you can either turn off the rule or better still edit them or write you own rules.
The rules get stored as part of your NDepend project, so it’s easy to tailor rules to each project you’re analysing.
Clicking on any of the hyperlink labels within the Code Rules section will show you the Rule in the “Queries and Rules Explorer” that has been run as part of the code rules. Clicking on the rule itself will then show you (in the left hand pane of VisualNDepend) the code that the rule is referring to.
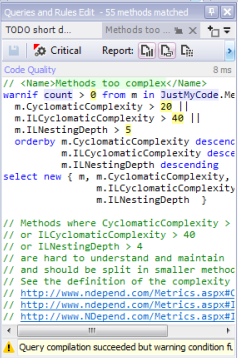
So for example the critical rule “Methods with too many parameters” will (when clicked on) show you all the methods/code that this violation was found in. At the top of the left hand pane will be the CQLinq code (the NDepend Linq like language) which IS the rule. This is very cool as you can not only view the rule code but from this window change the code and see results in real time or ofcourse save edited rules or create your own rules. As an example the “Methods with too many parameters” rule says methods with more than 8 parameters should fail this rule. If we change this to 10 we can immediately see those methods with more than 10 parameters and so on.
Here’s an example of the CQLinq code editor which helpfully also shows you the currently selected rule so it’s easy to copy and change the code or even make changes in the editor and see them immediately reflected in the list of methods/types etc. that are found using the rule.

Dashboard Graphs
Scrolling down the dashboard we’ll see a whole bunch of graphs for LoC, Rules Violated etc. where these come into their own is when you are saving the analysis results and can start to look at trends etc. over time. You can also add/remove charts to suit yours or your team’s needs.
Project Properties
I’m going to conclude this brief introduction (well maybe not so brief) with a quick look at the Project Properties tab (can be selected via Project | Edit Project Properties menu option).
From here you can add or remove assemblies from the analysis and change various project features.
An NDpend project is very useful, not just when using VisualNDepend but more so when running NDepend from a build tool such as FAKE. To be honest I’d actually say it’s a requirement really. From FAKE we can run NDepend against the project which will obviously include all own rules etc. and keep the team informed, not only of the current state of the project, but the trends within the project over time.
Note: at the time of writing FAKE’s NDepend capability expects a code coverage file to be supplied to it, otherwise it will fail due to the command line arguments FAKE passes to the NDepend console app. It works fine if you are supplying code coverage files. I’ve been using a modified version of FAKE, but hopefully we’ll see a fix in FAKE soon.
Where next…
This has just been an overview of NDepend, I will be posting more on using NDepend as I go along.
References
Getting Started with NDepend
NDepend Metrics placemat