Monthly Archives: April 2015

Writing your own CQLinq (NDepend) functions

To be honest this is well documented on NDpend’s web site – Defining a procedure in a query.

A previous post on CQLinq covered using a query to filter types for use in another CQLinq query. An alternate might be to create your own filter function.

To create a function in CQLinq we can simply create a Func variable and then create the code that is called when the variable is used, for example

let Ignore = new Func<IField, bool>(f => 
   f.ParentAssembly.Name == "ThirdPartAssembly"
)

Now to use the function we simply use it like this

from f in JustMyCode.Fields where
   !Ignore(f)

Filtering type’s by name using CQLinq (in NDepend)

I’m running NDepend against a project which also contains code from a shared application’s codebase. This “shared” code is really messing up my NDepend numbers. For example it contains some very complex methods and methods breaking a few rules my new project adhere’s to. This has the undesirable affect of meaning that the shared code can hide issues in the new code.

I cannot change this shared code without the introducing compatibility issues with the shared applications, so I simply want NDepend to ignore the types etc. from this shared code so I can see what’s happening in any new code more clearly.

As NDepend not only comes with a Linq like language (CQLinq) but also supplies us with the code for each rule and allows us to edit on a per project basis. This means we can simply alter the rule to ignore types and/or methods etc. that we’re aware of and are happy with or not wanting to change.

So let’s look at a snippet of CQLinq code which is used for the rule Do not hide base class methods.

// Define a lookup table indexing methods by their name including parameters signature.
let lookup = Methods.Where(m => !m.IsConstructor && !m.IsStatic && !m.IsGeneratedByCompiler)
      .ToLookup(m1 => m1.Name)
from t in Application.Types
where !t.IsStatic && t.IsClass &&
   // Discard classes deriving directly from System.Object
   t.DepthOfInheritance > 1 
where t.BaseClasses.Any()

As you can see, this query creates a lookup of types, using the Application.Types call. Basically this returns all types within the application being analysed (from my understanding). So if we could filter these types and exclude those which we’re unable/unwilling to change then we could still use this rule going forward but not have it failing on code we cannot do anything about.

So all we need to do is use some standard Linq code to filter the Application.Types, something maybe like this

// ignore types from external code
let filteredTypes = from filter
   in Application.Types where
   filter.Name != "MyObject"
   select filter

and replace Application.Types in the previous query so it becomes

// Define a lookup table indexing methods by their name including parameters signature.
let lookup = Methods.Where(m => !m.IsConstructor && !m.IsStatic && !m.IsGeneratedByCompiler)
      .ToLookup(m1 => m1.Name)
from t in filteredTypes
where !t.IsStatic && t.IsClass &&
   // Discard classes deriving directly from System.Object
   t.DepthOfInheritance > 1 
where t.BaseClasses.Any()

Ofcourse we might prefer to filter at a namespace or assembly level. In my case filtering out the external assemblies is a better solution in which case I simply remove the assemblies from the list of assemblies analysed by NDepend, but this technique for filtering is still useful.

It would be cool if we could use a UI such as VisualNDepend to create a “filtered” list for us, i.e. clicking on a type or method and “ignoring” it and have NDepend create a filter for us, but doing this this way ensure we’re very explicit about what to ignore.

AutoMapper Converters

When using AutoMapper, it may be that we’re using types which map easily to one another, for example if the objects being mapped have the same type for a property or the type can be converted using the standard type convertes, but what happens when things get a little more complex?

Suppose we have a type, such as

public class NameType
{
   public string Name { get; set;
}

and we want to map between a string and the NameType, for example

var nameType = Mapper.Map<string, NameType>("Hello World");

As you might have suspected, this will fail as AutoMapper has no way of understanding how to convert between a string and a NameType.

You’ll see an error like this


Missing type map configuration or unsupported mapping.

Mapping types:
String -> NameType
System.String -> AutoMapperTests.Tests.NameType

Destination path:
NameType

Source value:
Hello World

What we need to do is give AutoMapper a helping hand. One way is to supply a Func to handle the conversion, such as

Mapper.CreateMap<string, NameType>().
	ConvertUsing(v => new NameType { Name = v });

alternatively we can supply an ITypeConvert implementation, such as

public class NameConverter :
   ITypeConverter<string, NameType>
{
   public NameType Convert(ResolutionContext context)
   {
      return new NameType {Name = (string) context.SourceValue};
   }
}

and use in like this

Mapper.CreateMap<string, NameType>().
   ConvertUsing(new NameConverter());

AutoMapper Profiles

When creating mappings for AutoMapper we can easily end up with a mass of CreateMap methods in the format

Mapper.CreateMap<string, NameType>();
Mapper.CreateMap<NameType, string>();

An alternate way of partitioning the various map creation methods is using the AutoMapper Profile class.

Instead we can create profiles with as fine or coarse granularity as you like, here’s an example

public class NameTypeProfile : Profile
{
   protected override void Configure()
   {
      CreateMap<string, NameType>()
      CreateMap<NameType, string>();
   }
}

To register the profiles we need to then use

Mapper.AddProfile(new NameTypeProfile());

which can also become a little tedious, but there’s an alternative to this…

AutoAutoMapper Alternative

So instead of writing the code to add each profile we can use the AutoAutoMapper in the following way

AutoAutoMapper.AutoProfiler.RegisterProfiles();

this will find the profiles within the current assembly or those supplied as params arguments to the RegisterProfiles method for us. This way the profiles are registered for you.

Unit testing and “The current SynchronizationContext may not be used as a TaskScheduler” error

When running unit tests (for example with xUnit) and code that requires a synchronization context, one might get the test failing with the message

The current SynchronizationContext may not be used as a TaskScheduler.

The easiest way to resolve this is to supply your own SynchronizationContext to a unit test class, for example adding a static constructor (for xUnit) or in the SetUp method (in NUnit).

static MyTests()
{
   SynchronizationContext.SetSynchronizationContext(new SynchronizationContext());		
}

Note: xUnit supplies a Synchronization context when using async tests, but when running Reactive Extensions or TPL code it seems we need to supply our own.

WeakReferences in .NET

By default when we create an object in .NET we get, what’s known as, a strong reference to that object (in truth we usually simply refer to this as a reference, and omit the word strong). Only when the object is no longer required, i.e. it’s out of scope or no longer referenced can that object be garbage collected.

So for example

// object o can be garbage collected any time after leaving this method call
public void Run()
{
   var o = new MyObject();

   o.DoSomething();
}

// object o can be garbage collection only after the SomeObject is no longer used, 
//i.e. no longer any strong references to it exist
public class SomeObject
{
   private MyObject o = new MyObject();
}

This is fine in many cases, but the canonical example of WeakReference use is, what if MyObject is a large object and an instance of it is held for a long time. It might be that whilst it’s a large object it’s actually rarely used in which case it would be more efficient from a memory point of view if it’s memory was reclaimed if no strong references to it existed and then recreated when required.

If we’re happy for our object to be garbage collected and regenerated/recreated at a later time then we could instead create them as WeakReferences. Obviously from the examples above the method call is not a good fit for using a WeakReference as (assuming the method exists) this instance of MyObject will be garbage collected after the method exits and assuming no further strong references to the object exist. But let’s see how we might create a WeakReference stored as part of an object that might hang around in memory a while.

public class SomeObject
{
   private WeakReference o = new WeakReference();

   public void Run()
   {
      var myObject = GetMyObject();
      // now use myObject
   }

   private MyObject GetMyObject()
   {
      if(o.Target == null)
      {
         o.Target = new MyObject();
      }
      return o.Target;
   }
}

So in the above example we create a WeakReference, it’s best that we go through a helper method to get the instance of the object held within the weak reference, because we can then check whether the object still exists and if it doesn’t recreate it. Hence the GetMyObject method call.

So in GetMyObject, we check whether the weak reference’s Target property is null. In other words, either the data stored within the WeakReference has not been created or it has been garbage collected and we now need to recreate it. So assuming it’s Target is null we create the theoretically large object and assign it to the Target property. Otherwise we simply return the Target property.

At this point it appears we’re just creating something like the Lazy type. But the key difference is that unlike a Lazy type which creates an object when needed then holds a strong reference, the WeakReference not only creates the object when needed but also allows the garbage collection process to free the memory if it appears to be no longer needed. So obviously don’t store something in the WeakReference that tracks current state in your application unless you are also persisting such data to a more permanent store.

References

https://msdn.microsoft.com/en-us/library/system.weakreference(v=vs.110).aspx
https://msdn.microsoft.com/en-us/library/system.weakreference.target(v=vs.110).aspx
https://msdn.microsoft.com/en-us/library/ee787088%28v=vs.110%29.aspx

Testing Reactive Extension code using the TestScheduler

I often use the RX Throttle method, which is brilliant for scenario’s such as allowing a user to type text into a textbox and then only calling my code when the user pauses typing for an assigned amount of time. Or when scrolling up and down lists and when the user stops selecting items getting more data for the selected item from a webservice or the likes.

But what do we do about testing such interactions ?

Sidetrack

Instead of looking at the Throttle method, I needed to create a Throttle that actually buffers the data sent to it and when the timeout occurs gives the subscriber all the data not just the last piece of data (as Throttle would). So here’s some code I wrote (based heavily upon a StackOverflow post)

This post is meant to be about how we test such code, so let’s look at one of the unit test I have for this

[Fact]
public void ThrottleWithBuffer_EnsureValuesCorrectWhenOnNext()
{
   var scheduler = new TestScheduler();
   var expected = new[] { 'a', 'b', 'c' };
   var actual = new List<List<char>>();

   var subject = new Subject<char>();

   subject.AsObservable().
      ThrottleWithBuffer(TimeSpan.FromMilliseconds(500), scheduler).
      Subscribe(i => actual.Add(new List<char>(i)));

   scheduler.Schedule(TimeSpan.FromMilliseconds(100), () => subject.OnNext('a'));
   scheduler.Schedule(TimeSpan.FromMilliseconds(200), () => subject.OnNext('b'));
   scheduler.Schedule(TimeSpan.FromMilliseconds(300), () => subject.OnNext('c'));
   scheduler.Start();

   Assert.Equal(expected, actual[0]);
}

Now the key things here are the use of the TestScheduler which allows us the bend time (well not really, but it allows us to simulate the passing of time).

The TestScheduler is available in the Microsoft.Reactive.Testing.dll or from NuGet using Install-Package Rx-Testing

As you can see from the test, we now create the subscription to the observable and following that the scheduler is passed the “simulated” times. The first argument tells it the time an item is scheduled for, i.e. the first item is scheduled at 100ms, the next 200ms and finally 300ms. We then call Start on the scheduler to begin the time simulation.

Just think, if your code relied on something happening after a pause of a second then each test would have to wait one second before it could verify data, making a large test suit a lot slower to run. Using the TestScheduler we simply simulate a second passing.

An introduction to NDepend

What is NDepend?

NDepend is a static analysis tool which can be run from your build server or from Visual Studio or as a standalone application.

Disclaimer: The NDepend team kindly made available a copy of NDepend 5.4.1 Professional Edition for me to try out, any opinions within this or subsequent posts are wholly my own.

There’s so much information available within NDepend, from code quality analysis via line’s of code (LOC) through to method complexity analysis and more. Now all these metrics etc. would be useful as they are but NDepend also includes it’s own LINQ like language, where you can edit existing “queries” or create your own to suit your team’s needs.

To find out more about what NDepend is, check out the NDepend website or for a more complete explanation of what NDepend is check out the NDepend wikipedia page.

Let’s get started

I am going to use the NDepend standalone application for most of this post, so fire up VisualNDepend.exe.

For now let’s just use the “Analyze VS solutions” and “VS projects” options on the start page Select one of your projects and then you will see a list of assemblies that make up the project. This is a good point to remove anything you don’t want as part of the end report, i.e. I’ve got a bunch of web service auto-generated assemblies in one solution which I’m not too concerned to see metric on as they’re regenerated by tools (i.e. I’m not going to really be able to do much about the code).

Finally press the Analyze .NET Assemblies button.

Once NDepend has finished its analysis a report summary is created and will be displayed (by default) in a web browser window and VisualNDepend will prompt you asking what you want to do next. I’m going to select the View NDepend Dashboard.

The Dashboard

The dashboard is my preferred starting point. Here we can see lots of “high level” information about our solution. One of the projects I work on had over 469,000 lines of “my” code and for this project NDepend took only 45 seconds to generate it’s report – which means we can use NDepend as part of the build server processes without any real performance issues.

The following image shows part of the dashboard for one of my projects. It’s also demonstrating the changes to the project over time using the orange arrows, so my average method complexity has gone up from when I created a base line analysis, mind you everything except comments seems to be on the rise.

Dashboard snippet

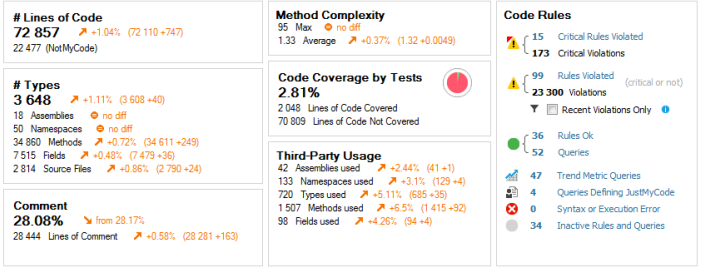
Note: The method with the Max complexity is actually a simple switch statement, obviously I took a look at it when it was highlighted in this way to see if it was something to be concerned about. The next step for me, would be to remove this from the complexity analysis results so it doesn’t hide something which is an issue.

Let’s move on an start to break down some of the features of NDepend…

# Lines of Code

This one’s pretty obvious, it shows us the number of lines of code in the solution broken down in my code and “NotMyCode”. In the solution I’m running this against at the moment, I see I have 72,857 lines of code in this application. 22,477 of those are “NotMyCode”. If we click on the number of lines of code (i.e. the 72,857 in my case) we’ll see in the “Queries and Rules Explorer” the “Trend Metrics” are selected. Within this node the “Code Size” is selected and we’ll see that NDepend ran 20 queries as part of this category of queries/rules and this shows the actual break down of LoC as well as the number of sources files etc.

I probably wouldn’t class this as a majorly useful metrics in and of itself, but it’s fun seeing how much code I’ve typed and/or generated for this project and ofcourse I know if I didn’t have it I would have wanted it!

One of the things NDepend can do is keep track of changes of the various metrics, so this might be useful if you see any strange spikes or troughs in your LoC. On the dashboard you’ll be able to scroll down to charts showing changes over time, along with the orange arrow indicators next to the dashboard items. I find this a really useful feature.

# Types

Similar to the LoC, this isn’t maybe one of those metrics you’ll be monitoring very much I suspect, but it’s still nice to get an overview of my project from different perspectives. In this current solution I have 3,648 types, 18 assemblies and so on.

Comment

This one’s probably the least useful metric for the projects I’m working on where comments can end up stale very quickly and therefore we tend not to comment too often. However when writing controls or libraries this metric would be very useful as I tend to be more active in comment usage etc. of methods in such scenarios. I was actually surprised to see I have, however, produced 28% of comments (I suspect a fair few of those were also from some of the autogenerated code I have included in this analysis).

Method Complexity

Now we get to some of the more interesting parts (in my opinion at least) of the analysis.

The method complexity figures within the Dashboard give us an overview, click on the “Max” text and you’ll again see the “Queries and Rules Explorer” change to show us the Max Cyclomatic Complexity for Methods.

The Cyclomatic complexity is a metric of the “number of independent paths through a program’s source code”. According to the NDepend documentation Cyclomatic Complexity (CC) a recommendation is that a CC value higher than 15 means the methods are hard to understand and maintain.

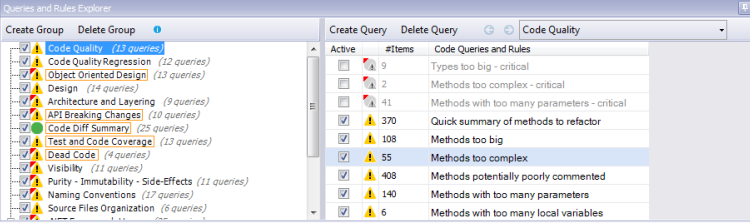
The following is a screen shot of the Queries and Rules Explorer, I’ve disabled some of the built in rules but you can see from the orange border around groups (on the left of the screenshot) that I still have plenty of critical issues outstanding in this project.

Queries and Rules Explorer

Code Coverage by Tests

If you’re using Visual Studio Premium, you get code coverage capabilities. If you save/export your code coverage results to a .coveragexml file this can be read in by NDepend and give me a run down of the LoC covered, the % of the total LoC covered and obviously the number of LoC no covered.

NDepend also supports dotCover and NCover code coverages results files.

Third-Party Usage

This shows us the number of third-party assemblies used etc. All self explanatory so I shall no expand upon here.

Code Rules

The Code Rules section shows us rules violated (critical and non-critical). For this post I’m not going to drill down every rule that I seem to have violated (maybe I’ll leave that for another post). Obviously a tool like NDepend has to have a starting point for what rules it classes as critical – I didn’t always agree with it but that’s not a problem becase you can either turn off the rule or better still edit them or write you own rules.

The rules get stored as part of your NDepend project, so it’s easy to tailor rules to each project you’re analysing.

Clicking on any of the hyperlink labels within the Code Rules section will show you the Rule in the “Queries and Rules Explorer” that has been run as part of the code rules. Clicking on the rule itself will then show you (in the left hand pane of VisualNDepend) the code that the rule is referring to.

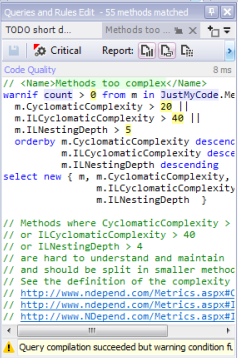
So for example the critical rule “Methods with too many parameters” will (when clicked on) show you all the methods/code that this violation was found in. At the top of the left hand pane will be the CQLinq code (the NDepend Linq like language) which IS the rule. This is very cool as you can not only view the rule code but from this window change the code and see results in real time or ofcourse save edited rules or create your own rules. As an example the “Methods with too many parameters” rule says methods with more than 8 parameters should fail this rule. If we change this to 10 we can immediately see those methods with more than 10 parameters and so on.

Here’s an example of the CQLinq code editor which helpfully also shows you the currently selected rule so it’s easy to copy and change the code or even make changes in the editor and see them immediately reflected in the list of methods/types etc. that are found using the rule.

Code Editor

Dashboard Graphs

Scrolling down the dashboard we’ll see a whole bunch of graphs for LoC, Rules Violated etc. where these come into their own is when you are saving the analysis results and can start to look at trends etc. over time. You can also add/remove charts to suit yours or your team’s needs.

Project Properties

I’m going to conclude this brief introduction (well maybe not so brief) with a quick look at the Project Properties tab (can be selected via Project | Edit Project Properties menu option).

From here you can add or remove assemblies from the analysis and change various project features.

An NDpend project is very useful, not just when using VisualNDepend but more so when running NDepend from a build tool such as FAKE. To be honest I’d actually say it’s a requirement really. From FAKE we can run NDepend against the project which will obviously include all own rules etc. and keep the team informed, not only of the current state of the project, but the trends within the project over time.

Note: at the time of writing FAKE’s NDepend capability expects a code coverage file to be supplied to it, otherwise it will fail due to the command line arguments FAKE passes to the NDepend console app. It works fine if you are supplying code coverage files. I’ve been using a modified version of FAKE, but hopefully we’ll see a fix in FAKE soon.

Where next…

This has just been an overview of NDepend, I will be posting more on using NDepend as I go along.

References

Getting Started with NDepend
NDepend Metrics placemat